Within both in the Investment options and Superfund options you have the ability to view Performance Charts of portfolios displayed on the screen using End of Day data results.
End of Day (EoD) data is- End of Last Trading day Data, which is collected in the previous 24 hrs of trading.
This is an important aspect to understand, what you are viewing is yesterdays performance and not real-time performance reporting.
In each of the Tabs is the ability to view the performance in graphical nature, as you will see, the graph reflects the live position of your clients funds and calculates the increase in overall yield of the fund.
The viewing option is open to ALL investment times, Assets and Share Trades, Super funds (subject to reporting) and SMSF Investments.
You can structure the display to list non-reporting asset classes, for example your client may have an Oil Painting worth $250,000 that they plan to use as part of their Retirement Strategy though the Asset does not sit within any Asset Class or Investment/Super Fund holdings.
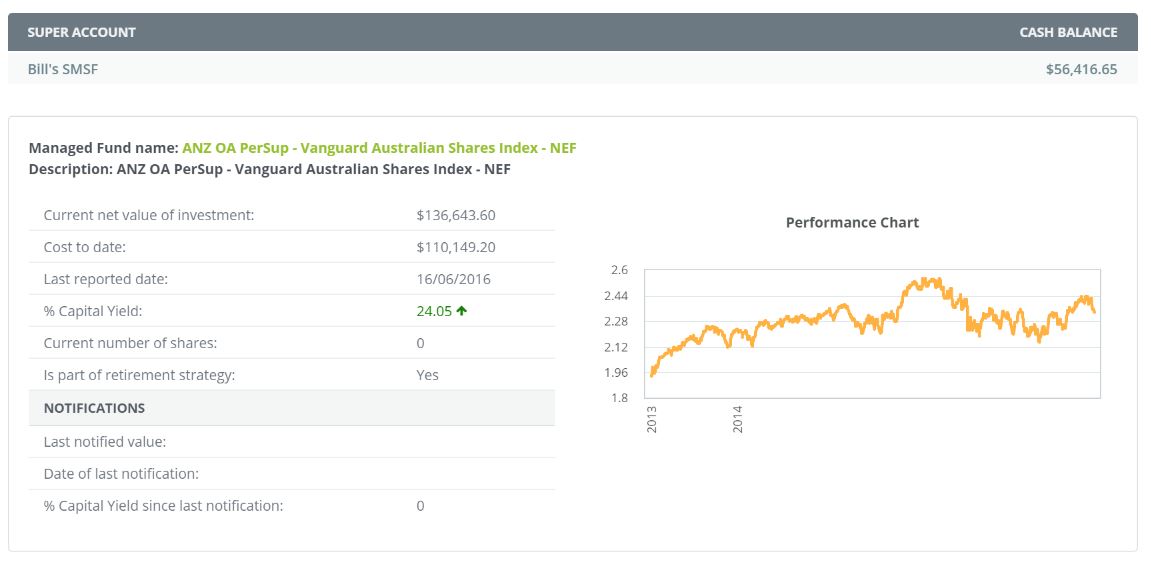
In the display you will see the Fund Name, Value, last reported date of the fund, % capital yield, number of shares (if equity based) if it is indeed part of the retirement strategy and **last notification value, date of last notification and % yield since last notification.
** last notification value, date of last notification and % yield since last notification reflect the Client outbound communication that was automatically dispatched to the client (if you have elected this option to occur.
0 Comments